With an audience of nearly 3 billion, Facebook advertising presents unmatched potential to connect with targeted customers. However, the platform provides a sea of data that can overwhelm novice advertisers. Don't let the complexity dissuade you. Track the right key performance indicators (KPIs) to transform aimless ad spend into poised strategy. We'll guide you through the 10 most vital Facebook ad KPIs to monitor in 2024 for optimal performance. From illuminating audience insights to campaign cost metrics and everything in between, this definitive guide outlines the essential lights leading the way to Facebook advertising success. Whether launching new campaigns or optimizing existing ones, these are the metrics to watch thrive.
What are Facebook ads KPIs?
Facebook advertising KPIs (key performance indicators) are vital metrics that measure your ad performance and guide data-driven decisions. Rather than getting lost in vanity metrics or secondary data points, smart advertisers focus on the KPIs aligned with their specific campaign goals and target outcomes.
The top Facebook ad KPIs provide quantifiable insight into your business growth, audience engagement, cost efficiency, and return on ad spend. Essentially, Facebook advertising KPIs act as your north star, revealing areas of optimization to build effective strategies that convert. They transform guesswork into confident, calculated steps toward better ads.
As you navigate Facebook's ocean of possible data, keep your eyes fixed on the KPI horizon based on your intended destination. Whether aiming to increase brand awareness, website traffic, online sales, or other objectives, anchor your tracking, testing, and budget decisions around the key indicators that matter most for Facebook advertising success.
10+ Facebook ads KPIs & metrics to track for success
Monitoring this balanced set of Facebook Ads KPIs gives insight into campaign performance and optimization opportunities across both ads and landing pages. Rather than focusing on vanity metrics like reach and impressions, these KPIs reflect tangible value driving outcomes. Let's explore what to track for Facebook Ads success!
CTR
Click-through rate (CTR) measures the percentage of times people clicked your ad after it was shown to them. This reveals how compelling your messaging and creative is to drive engagement.
A higher CTR signals your ad resonates with your target audience. It means more impressions convert to link clicks rather than being ignored.
Aim for CTRs above your industry average. For example, education ads see 0.9% CTR versus 2.2% for ecommerce ads. Review your CTR by ad set and creative to identify high and low performers.
Test changes to improve CTR:
- Attention-grabbing visuals following Facebook's 20% text overlay rule
- Clear, concise copy promising viewer benefit
- Dynamic video content under 15 seconds
- Streamlined call-to-action button
Give changes time across split test ad sets before assessing performance. Sort ad sets by CTR to double down on what’s working.
Rising CTR lifts both paid traffic and organic reach. It proves your messaging strongly resonates as relevant and valuable to viewers.
Cost Per Result
Cost per result (CPR) reveals how much you spend to acquire each conversion towards your campaign goals. For lead generation campaigns, measure cost per lead (CPL). For sales, track cost per purchase (CPP). Lower CPR demonstrates greater campaign efficiency and return on ad spend.
Benchmark CPR against industry averages and monitor trends over time. For lead generation, software CPL averages $45 vs $15 for services. As you scale spend, optimize to decrease CPR.
Breakdown CPR by:
- Ad sets to identify top/bottom performers on conversion costs
- Demographics to see which segments convert more efficiently
- Placements with the lowest conversion prices
- Creative and copy effectiveness at driving conversions
If CPR rises, assess changes needed to re-engage your audience. Refresh creatives, target expanded interests aligned to your offer, and customize landing page experience.
CPR proves what you pay to acquire customers and leads. Minimize it by relentlessly testing campaign components and spending on highest-converting elements.
Cost Per Click (CPC)
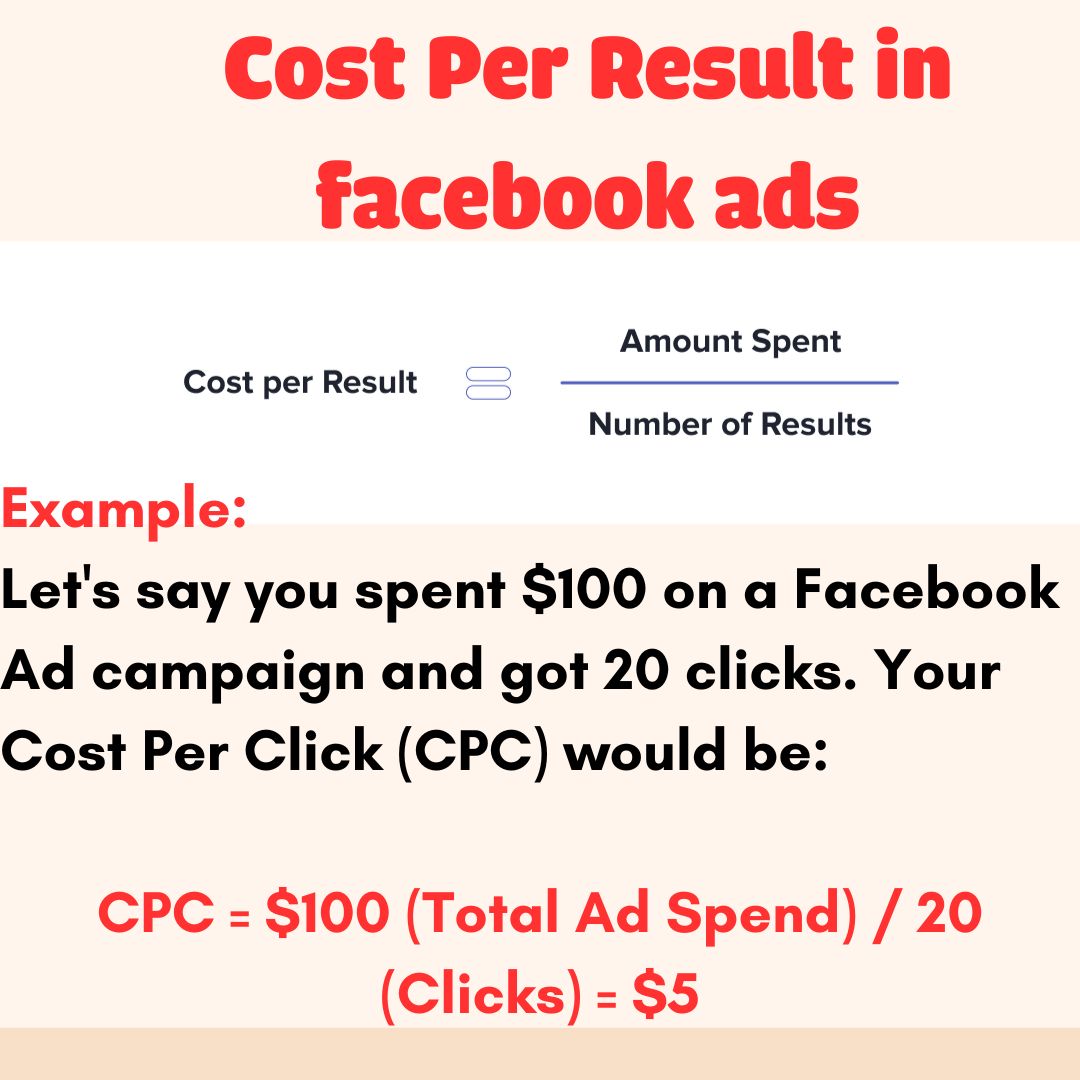
Cost per click (CPC) measures your total ad spend divided by the number of times users clicked on your ads to reach your site or app post-click. It reveals how much you pay to drive each link click across achieved campaign impressions.
Track CPC over time and whether it falls within your expected range. Study the ecommerce average CPC of $1.99 and target that or less through efficient targeting and messaging.
Study CPC trends:
- By ad set to detect settings with higher costs due to broad terms or high competition
- By demographics, e.g. women 35-45 may click more relevantly versus men
- By device to determine lower CPC placements
A rising CPC could indicate ad fatigue among hyper-targeted groups, hinting at refreshed copy and creatives. Or broad targeting driving irrelevant impressions and expensive clicks.
Aim to lower CPC while still achieving conversion goals. Get more value from your clicks by tightly targeting interested segments ready to engage or convert. Boost click quality through compelling ad copy focused on burning needs.
Return on Ad Spend (ROAS)
Return on ad spend (ROAS) calculates the revenue driven by your campaigns as a percentage of total dollars spent. It quantifies profitability to determine if you gain more than you pay for ads.
The higher the ROAS, the greater the positive return from your budgets. For example, a ROAS of 500% means for every $1 in ad spend, you generated $5 in revenue.
Benchmark target ROAS against your margins:
- Low margin businesses like ecommerce target 2X-3X
- High margin software aim for 5X-10X
Monitoring ROAS helps gauge campaign profitability and where to allocate dollars. Calculate ROAS:
- By campaign to guide budget
- For individual ad sets
- Across demographics
- On different placements
If ROAS dips, pause poor performing ads first. Next assess why ROAS dropped - due to lower conversions or heightened spending. Make adjustments like raising bids or changing targeting rules accordingly.
ROAS is a key indicator of paid marketing value. Measure it to maximize returns from ad dollars spent.
Engagement rate
Engagement rate reveals how often people interact with your ads through likes, shares, and comments after seeing them. It's calculated by total engagements divided by total impressions.
A higher engagement rate signals your messaging strongly resonates. Benchmark against the average 0.9% rate for Facebook ads across industries.
Monitor engagement rate trends:
- Across ad sets to determine most intriguing hooks and creative
- Based on audience demographic and interest targeting
- By placement, with Instagram often driving higher engagement
High impressions but low engagement can suggest fatigue from over targeting or irrelevant messages missing the mark. Test new creative angles and hook-driven copy.
While link clicks directly impact conversions, high engagement lifts organic reach as people interact with ads more. This expands awareness among friends.
Aim for over 1% engagement as a sign your content creation inspires audience reaction. Engagement precedes action so optimize ads to inspire it.
Impressions
Impressions track how many times your ads were displayed. It does not represent unique people as the same users may view an ad multiple times.
Unlike vanity metrics like reach, impressions measure media costs for exposure. Compare impressions to engagement and conversions to assess cost efficiency.
Benchmark impression volume against industry averages. For example, 10 million+ monthly impressions may be suitable for national ecommerce brands versus much lower volumes expected for local businesses.
Optimizing for more impressions does not guarantee better results. Focus on improvements per impression:
- Lower cost per impression (CPM)
- Higher click-through and engagement rates
- Increased return on ad spend
Too many impressions with limited conversions can signal targeting the wrong audiences or wasted spend from broad keywords. Refine your ad set custom audiences and placements instead for qualified reach.
Measure impressions relative to bigger business impact. Scale them strategically through targeting and creatives optimized to convert each exposure.
Conversion Rate
The conversion rate reveals what percentage of people took your desired action after clicking your ad. Improving conversion rate optimizes ad results.
Conversion actions depend on campaign goals, like:
- Registration rate for lead gen
- Purchase rate for ecommerce
- Content download rate
The conversion rate formula equals total conversions divided by total link clicks from your ads. Benchmark against industry averages to evaluate performance.
Study conversion rate:
- Across creatives to determine most impactful designs
- By demographic for highest-converting segments
- On different placement types
Low conversion rates despite clicks suggest poorly targeted audiences without motivation or intent. Or subpar post-click landing page experience failing to convince visitors.
Lift conversion rates through compelling and benefit-focused ad copy. Ensure your landing pages deliver on what your ads promise target segments. Conversion rate proves real world value from ads.
Ad frequency
Frequency shows the average number of times your ads were served to each person. It's estimated by impressions divided by estimated reach.
Monitor frequency to avoid overexposing disinterested users or seeming spammy. Ideal frequency ranges between 1-4 views per user depending on campaign objectives:
- Brand awareness campaigns can use higher frequency for increased familiarity
- Direct response aims for 1-2 views to motivate immediate action
Study frequency:
- By ad set to detect narrow versus broad targeting
- With engagement rate to watch for fatigue signs
- Against conversion rate lift over time
A frequency over 4x without more conversions signals possible irritation without relevance. Refresh creative and copy to reconnect with audiences. Shift budget to better performing targeting.
Balance frequency high enough for awareness but low enough to seem fresh and worth engaging. Set frequency caps per user if needed to control oversaturation risk.
Conversions
Conversions track how many ad clickers completed your desired goal action - from email signups to purchases. It proves real business value beyond vanity metrics.
Study conversions:
- By campaign objective for clear goal progress
- Across different creatives and their messaging
- Over time to spot trends and optimization impacts
Low conversion rates despite heavy traffic highlight disconnects between your ads and landing pages. Review post-click experiences for relevance to what was promised.
Install the Facebook pixel and leverage UTMs tying ads to goals. This reveals:
- True conversion performance by campaign
- Assists retargeting audiences who previously converted
Compare conversions to costs for your target return on ad spend (ROAS). Scale spend on elements with the strongest conversion rates while pausing poor performers dragging down results.
Conversions represent clear cut customer acquisition thanks to ads. Measure across funnels to reduce leaks optimizing your paid media impact.
Link clicks
Link clicks track total ad clicks leading users to destinations on or off Facebook. It signals interest and intent to learn more after your message hooks them.
Study link clicks:
- By ad creative to ID most effective facebook ad designs and copy
- By device and placement for optimal delivery channels
- For each call-to-action to determine most compelling
Compare link clicks to impressions for your click-through-rate (CTR). Higher CTRs suggest strong resonance and relevancy.
While impressions raise awareness, clicks represent real engagement. Analyze landing page performance after clicks for conversions. Use UTM campaign tracking to monitor value by ad and audience source.
Yet more link clicks don’t directly equal more conversions if poor targeting or messaging. Assess link click quality through relative value metrics like cost per click and conversion rate.
Link clicks precede site actions so optimize ads to inspire high-intent clicks. Compelling messages and seamless user experience drive conversions from each tap.
Reach
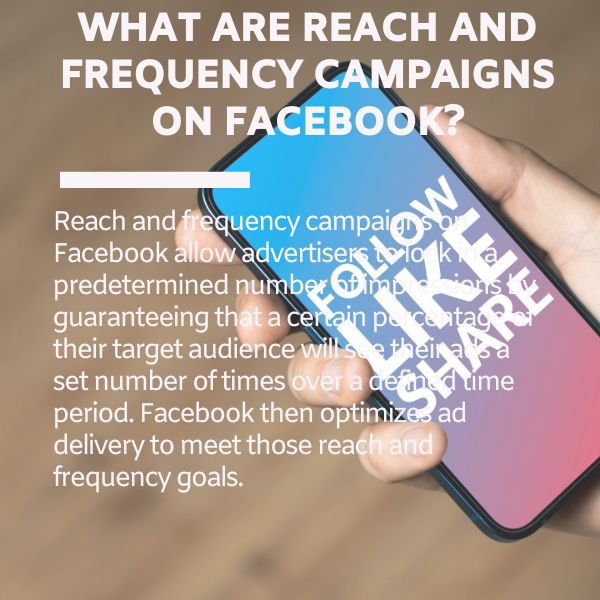
Reach shows how many unique people saw your Facebook ads during a given timeframe. It reveals potential awareness lift and audience size capacity.
Study reach:
- By campaign to detect targeting limitations
- For different creatives to ID broadest appeal
- Against impressions to gauge frequency
Yet high reach alone has vanity. Compare to engagement and conversions to assess resonance and ROI rather than just exposures.
Low reach despite adequate spend can signal restrictive targeting or niche appeal. Test expanding audiences aligned to your ICPs and offers. But avoid over-targeting at the expense of relevance.
Balanced reach that also drives business outcomes comes from thoughtful audience selection and compelling messages. Dial these in rather than solely chasing maximum views.
While vital, reach remains just the first step towards measurable objectives. Optimize it in tandem with superior click-through rates and conversion performance. Initial awareness means little without subsequent action.
Ad Relevance
Ad relevance measures how well your targeting and creative resonates with users to spark expected actions. Facebook tracks relevance through metrics like:
- Quality ranking against competing ads
- Engagement rate position percent
- Conversion rate position percent
High relevance scores deliver these benefits:
- Lower advertising costs per result
- Improved ad delivery positioning
- Increased click-through and conversion rates
Check relevance diagnosis frequently:
- By ad set to detect poor performers
- Based on various creatives and messages
- Comparing new ads against proven winners
Irrelevant ads show below average across rankings due to ineffective elements like messaging, visuals or targeting. The lowest 20%+ see limited impressions.
Improve relevance with compelling hooks aligned to audience needs. Test emotional and benefit-driven copy. Ensure landing pages deliver on what ads promise.
Follower Demographics
Monitor follower demographics to ensure your content and messaging reaches your ideal target audiences. Study metrics like:
- Age range
- Gender
- Location
- Languages
Compare followers against your customer avatars across:
- Facebook Page
- Instagram Business Profile
- Across ad accounts
Mismatched follower versus customer demographics can signal poor targeting and wasted impressions. For example, mostly men 55+ following a women's ecommerce page points at low relevance.
Drill into audience insights under Page settings. Identify under-indexed targets and their interests to refine audiences and creatives.
Balancing scale with meaningful reach requires thoughtful audience targeting. Analyze follower demographics to pinpoint growth opportunities in aligned yet underserved segments. Qualified impressions drive results.
Page Likes
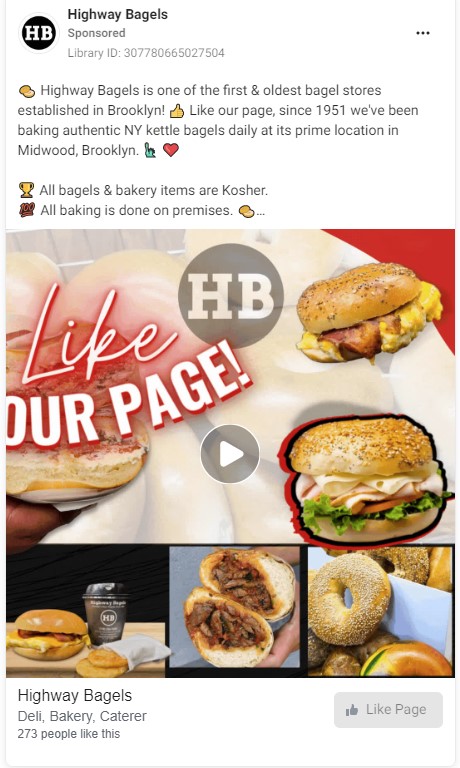
Page likes show how many new people clicked to follow your Facebook Page after viewing your ads. It signals growing brand awareness and organic reach potential.
Compare Page likes driven by different:
- Campaign objectives to determine awareness tactics
- Ad creative and messaging for the biggest fan building hooks
- Targeting parameters around interests and behaviors
While vanity metrics, growing Page likes expand visibility as followers see your organic content. This can decrease future reliance on paid ads.
Yet focus on qualified followers likely to actively engage. Analyze follower demographics to ensure alignment with your audience personas.
Also track Page like conversion value:
- Engagement rate of followers
- Additional conversions from retargeting
- Unfollow rate showing retention
Optimize ads to build your tribe of brand advocates. But also drive clear outcomes atop basic fandom.
Reach by Post Type
Compare reach performance for different post formats - link posts, text statuses, photos and videos.
Analyze unique 1-day or 7-day reach averages per post type published to your Facebook Page over set periods.
This reveals what content style and messaging most effectively grabs audience attention.
For example, funny visual memes may see higher reach than promotional text statuses. Video views can significantly outpace photos.
Study reach by post type alongside other metrics:
- Impressions for frequency caps
- Engagement rate for interaction
- Clicks and conversions to calculate ROI
Let high-reach formats guide more content creation. But also prioritize the types that inspire actions beyond passive reach.
Balance visual interest with captions delivering value. Test different post formats while maintaining brand voice and quality to expand organic exposure.
FAQs about Facebook Ads KPI
How do you measure effectiveness of Facebook ads?
The most effective way to measure Facebook ad performance is through cost per conversion metrics like cost per lead (CPL) or cost per purchase (CPP). These reveal your cost to acquire each customer. Lower CPAs demonstrate greater ROI and efficiency from your ad spend.
What is the most important metric for Facebook ads?
Link clicks are a highly important Facebook Ad metric, signaling your target audience's interest level in clicking from your ad through to content. Compare link clicks to site conversions to optimize based on real conversions generated per click.
How much should you scale Facebook ads?
When scaling Facebook ad spend, limit budget increases to 20% increments every 3-5 days. Conservative scaling allows you to monitor campaign results as spend rises to ensure positive return on ad spend (ROAS). If metrics like CPA, CTR or conversions dip, pause scaling to refine targeting and creatives boosting performance.
Monitoring and optimizing our Facebook ads based on the right key performance indicators leads to tremendous improvements in conversion efficiency and campaign results. By tracking metrics ranging from click-through and engagement rates to critical cost and return on ad spend benchmarks, marketers can hyper-target both audiences and messaging. This allows us to connect with our ideal audiences at scale while driving higher quality leads and sales at lower costs - the markers of impactful ad spend. Diving deep into the data of both ad and landing page analytics empowers us to continuously enhance campaigns through insights, propelling our Facebook Ads outcomes to the next level.

Mohamed Fouad is a full-stack web developer and an entrepreneur who's really into advertising. He is the CEO of Rent Ads Agency, a company that helps businesses reach more customers through advertising. He graduated from Stanford University in 2018 and has over 4 years of experience in the tech industry.
