With over 2 billion daily active users, Facebook remains the reigning king of social media platforms. This massive audience is why Facebook ads continue to be an incredibly popular tool for businesses aiming to increase brand awareness, reach prospects, and gain new customers.
But how can you truly determine if your Facebook ad performance is up to par? We have the latest benchmarks to provide those answers!
Equipped with fresh data to inform your 2026 planning, this guide shares the most current Facebook advertising benchmarks across 20 industries. You'll find key metrics like click-through rate, cost per click, conversion rate, and more for two of the most common Facebook campaign objectives.
Use these updated Facebook Ads benchmarks as your guide to evaluate how your Facebook advertising stacks up. Discover where you can improve your ad strategy and execution to get more from your ad spend in the new year. With these insights in hand, you can make data-driven decisions to refine your Facebook Ads approach and achieve your 2026 business goals.
Average Click-Through Rate on Facebook
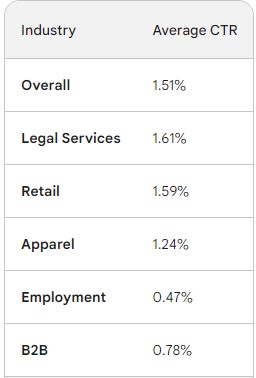
The average Click-Through Rate (CTR) on Facebook Ads across all industries for traffic campaigns is currently around 1.51%. This means that for every 100 impressions your ad receives, roughly 1.5 people click on it. Getting clicks is the lifeblood of successful Facebook advertising. But not all industries enjoy equal footing when it comes to driving clicks.
Some verticals have inherent advantages:
- Legal services dominate with a 1.61% CTR. Ad copy that taps into urgent client needs and clearly conveys value propositions can readily capture attention in the news feed.
- Retail (1.59%) and apparel (1.24%) also see high click-through thanks to eye-grabbing product visuals and models that spark interest.
Other industries face stiffer challenges breaking through:
- Employment ads lag at 0.47% CTR. Job seekers likely aren't scanning social feeds to further their hunt.
- B2B CTR also drags at 0.78%. Busy business buyers aren't on Facebook to research solutions.
While the average CTR across industries is 0.90%, don't settle for average results. The key is aligning your strategy with your audience's mindset and intent:
- Traffic driving campaigns warrant higher targets near 1.5% CTR.
- Dial in your targeting to engage your ideal audience.
- Lead with compelling imagery and urgent copy that speaks directly to their needs.
Benchmark CTRs provide a pulse check. But taking an optimized approach tailored to your vertical and campaign goals is the only way to truly move the needle.
The Cost of Clicks: Average CPC Benchmarks for Facebook Ads
When evaluating the cost-effectiveness of your Facebook ads, look beyond overall spend to cost per click (CPC). This metric indicates how much you pay each time someone clicks your ad. And it varies dramatically by industry.
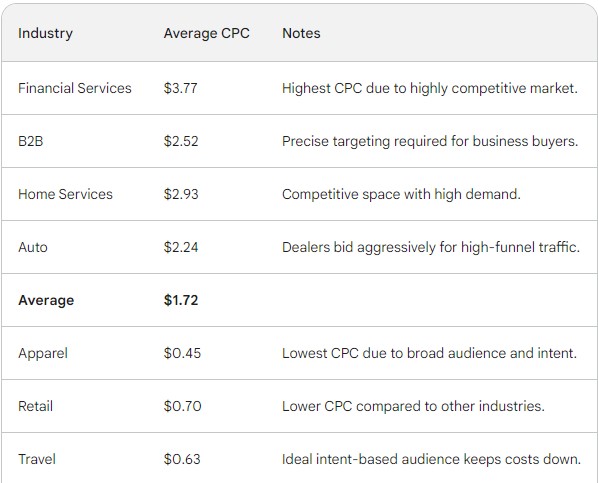
At the high end, financial services drives the steepest CPC at $3.77. But with insurance and lending keywords running over $50 per click on Google, finance brands still find strong value in Facebook's vast audiences and targeting capabilities.
Other sectors ponying up over $2.50 per click include:
- B2B ($2.52 CPC) - Business buyers require precise targeting.
- Home Services ($2.93 CPC) - Competitive space drives up costs.
- Auto ($2.24 CPC) - Dealers bid aggressively for high-funnel traffic.
Alternatively, apparel and retail enjoy the lowest average CPCs at $0.45 and $0.70 respectively. Travel also clicks in at a modest $0.63. The expansive reach and ideal intent-based audience for these verticals brings costs down.
While the average CPC across Facebook comes out to $1.72, strategic targeting, bidding, and budget management can help you gain an edge for your niche. Monitor CPC over time todiagnose issues like irrevelant clicks or overspending. Let your CPC benchmarks direct optimizations.
Average Conversion Rates by Industry for Facebook Ads
While the average conversion rate (CVR) for Facebook ads comes in at 9.21% across industries, some verticals leverage the platform's audiences and capabilities for massive impact at the bottom of the funnel.
Fitness leads the charge with a phenomenal 14.29% average conversion rate. Facebook provides direct access to enthusiastic prospects ready to try a new gym or fitness program. Similarly, education (13.58% CVR) and employment/job training (11.73% CVR) ads connect with audiences actively looking to advance their careers.
Other top industries for Facebook conversion rates include:
- Healthcare (11% CVR): Lead gen drives appointments.
- Real Estate (10.68% CVR): Home buyers close from Facebook leads.
- B2B (10.63% CVR): Businesses drive pipeline growth via Facebook.
Meanwhile, industries like retail (3.26% CVR), travel (2.82% CVR), and technology (2.31% CVR) trail behind. Still, smart remarketing can nurture prospects until they convert across nearly any vertical.
The key is aligning your campaign objectives, creatives and messaging to your audience's mindset when they land on your ad. Speak to their intents and provide a seamless path to conversion from first click to landing page and you can smash average industry conversion benchmarks. Monitor your conversion waterfall to identify and resolve leaks for continual optimization.
Average Conversion Rates by Industry for Facebook Ads:
| Industry | Average Conversion Rate (CVR) | Notes |
| Fitness | 14.29% | High intent audience actively seeking new options |
| Education | 13.58% | Individuals actively looking for career advancement |
| Employment/Job Training | 11.73% | Similar to education, high intent audience |
| Healthcare | 11.00% | Lead generation drives appointments |
| Real Estate | 10.68% | Home buyers convert from Facebook leads |
| B2B | 10.63% | Businesses build sales pipelines |
| Restaurants & Food | 5.63% | Can be improved with targeted marketing |
| Sports & Recreation | 8.24% | High potential with engaging campaigns |
| Retail | 3.26% | Can benefit from remarketing strategies |
| Travel | 2.82% | Lower conversion rate, requires strong messaging |
| Technology | 2.31% | May require unique ad strategies for conversions |
| Average (All Industries) | 9.21% | Consider industry benchmarks for comparison |
The Cost of Conversions: Average CPA Benchmarks for Facebook Ads
When assessing the value of your Facebook advertising, cost per action (CPA) spotlights the all-important return on ad spend. This metric indicates how much you effectively pay when someone engages with your ad and takes a desired action like making a purchase or downloading your app.
And as with other KPIs, average CPAs fluctuate immensely across verticals depending on audience intent, product value, and competitive dynamics:
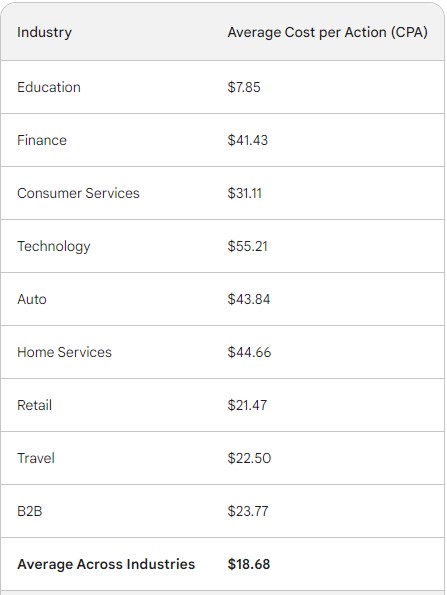
Education enjoys the lowest barrier to action with a CPA of just $7.85. Meanwhile auto ($43.84 CPA), home services ($44.66 CPA) and technology ($55.21 CPA) pay huge premiums per converted customer - but can earn back the acquisition costs over long and lucrative lifetime cycles.
Finance ($41.43 CPA) and consumer services ($31.11 CPA) also invest heavily upfront given the potential worth of high-quality leads.
Alternatively, reasonable CPAs in sectors like retail ($21.47), travel ($22.50), and B2B ($23.77) demonstrate that cost-efficient conversions at scale are attainable for the right campaign.
While the average cost per conversion across industries lands at $18.68, calculated targeting and testing allows you to optimize both action value and volume for your niche. Unpack your conversion waterfall, expand your niche audiences, and continually raise perceived value to drive down CPA.
Actionable Tips for Better Facebook Ad Results
Industry averages serve as useful initial benchmarks. However, developing a winning Facebook Ads strategy requires going beyond the norms in your vertical and campaign objectives.
If your cost, click or conversion metrics underperform top quartile KPIs, tap into these optimization levers based on an analytical review of diagnostics:
- Audience Targeting: Fine-tune buyer targeting parameters around demographics, interests and behaviors demonstrating the highest Facebook post engagement and conversion rates.
- Ad Creative Testing: Implement an agile creative testing program across ad elements like imagery, captions, calls-to-action and formats to determine optimal configurations.
- Landing Page Alignment: Assess user flow from ad click to landing page against drops in the conversion funnel. Tighten message continuity.
- Bidding Rules: Customize bid amounts based on target customer potential value to balance volume and conversion quality.
- Campaign Timeframes: Schedule ads to match periods of peak buyer intent signals like industry conferences or seasonal demand spikes.
Ongoing analysis reveals what resonates with your distinct market segments over time. An iterative optimization mindset empowers advertisers to unlock results exceeding the average.
Best industries for Facebook ads
Certain verticals consistently achieve standout results on Facebook advertising thanks to engaged users, buying signals, and processes optimized for conversions. While every business can potentially find value, these sectors tend to shine the brightest.
Commerce Brands
Retailers and ecommerce merchants remain Facebook’s bread and butter. Several unique factors propel performance:
- Visually-driven product discovery journey
- Enthusiastic communities and recommendations
- Cart abandonment remarketing capabilities
- Streamlined checkout and payments
Travel Marketers
Inspiring audiences to book rides Facebook’s core visual storytelling advantage. Key strengths include:
- Ability to tie stunning travel imagery to special offers
- Targeting based on travel planning signals and past trips
- Dynamic ads highlighting specific destinations
- Remarketing past website visitors
Financial Services
For major customer life events requiring consideration, Facebook provides a pivotal platform for educating prospects.
- Auto, mortgage and insurance shoppers actively signal buying needs
- Lead gen forms help convert lookers into applicants
- Lookalike modeling expands relevant audiences
- Retargeting nurtures customers through sales funnel
While wide potential exists, these verticals provide models for innovation and success other industries can emulate. Aligning to both user behaviors and a sales funnel approach unlocks the platform’s true potential.
When assessing Facebook advertising performance, industry benchmarks provide initial guidance. However, thoughtful targeting, relentless optimization, and embracing creative best practices tailored to your vertical and campaign goals empower advertisers to continually exceed norms. Use the latest Facebook benchmarks as your launch point to drive results.

Mohamed Fouad is a full-stack web developer and an entrepreneur who's really into advertising. He is the CEO of Rent Ads Agency, a company that helps businesses reach more customers through advertising. He graduated from Stanford University in 2018 and has over 4 years of experience in the tech industry.